Regional focused climate models are needed to account for synoptic and mesoscale atmospheric features.
Data from the so-called REgional MOdel (REMO)
is used in order to get high-resolution data. The REMO domain covers a limited area of the
globe and is set in the west-east direction from
30°W to 60°E and in the south-north direction from 15°S to 45°N. The area contains
the Mediterranean Sea, the whole subcontinent of West Africa, tropical Africa and the Arabic
Peninsula. Several REMO runs are used in order to force the LMM. The past period starts in 1960 and ends in
2000. The data set consists of three ensemble runs that account for uncertainties arising from the
mainly unknown initial conditions.
REMO climate projections
In addition climate projections are available for the period of 2001 to 2050 according to the
climate scenarios A1B and B1 as well as land use and cover changes that are in line with the Food and
Agriculture Organization (FAO) (see page "Scenarios").
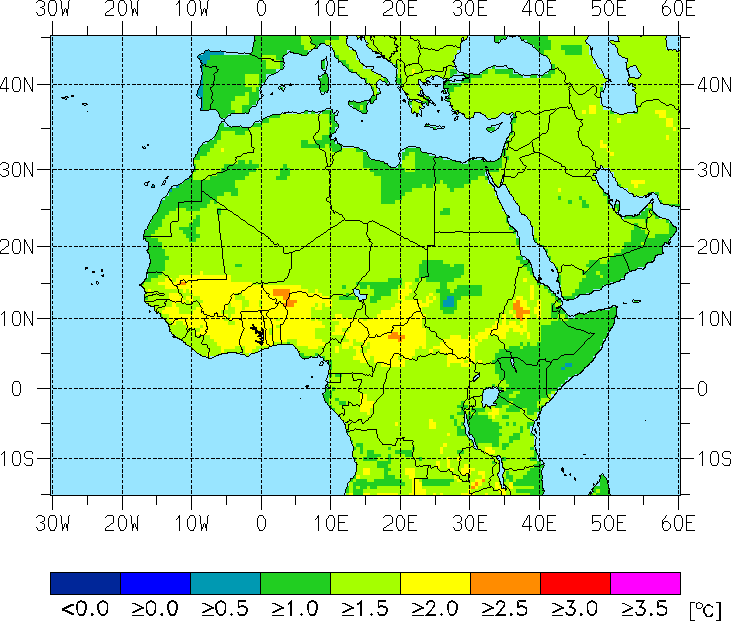
Both scenarios lead to a prominent surface heating and a
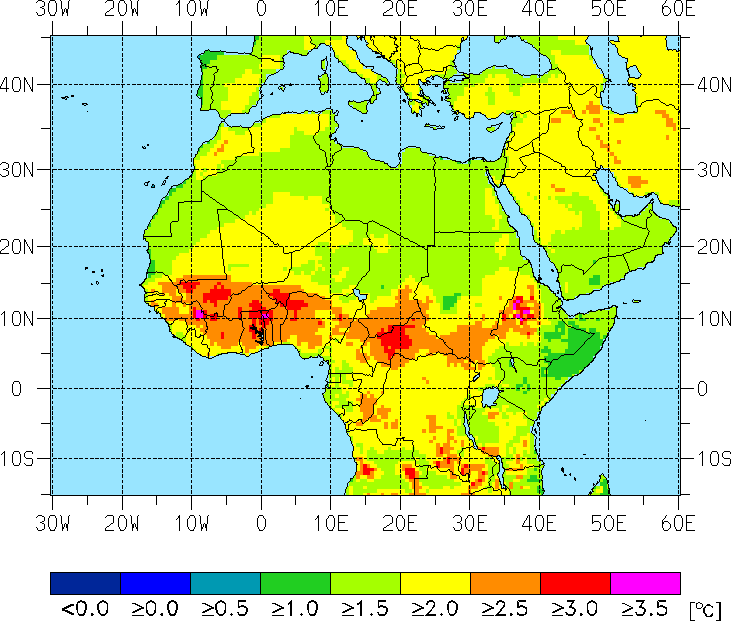
weakening of the hydrological cycle over most of tropical Africa. The temperature increase is mostly
pronounced in the 2040th in scenario A1B. The maximum temperature increase is found in the tropical
region at about 10°N. Unlike the global circulation models of the IPCC 4th assessment report
predict the highest temperature increase over the area of the Saharan desert.
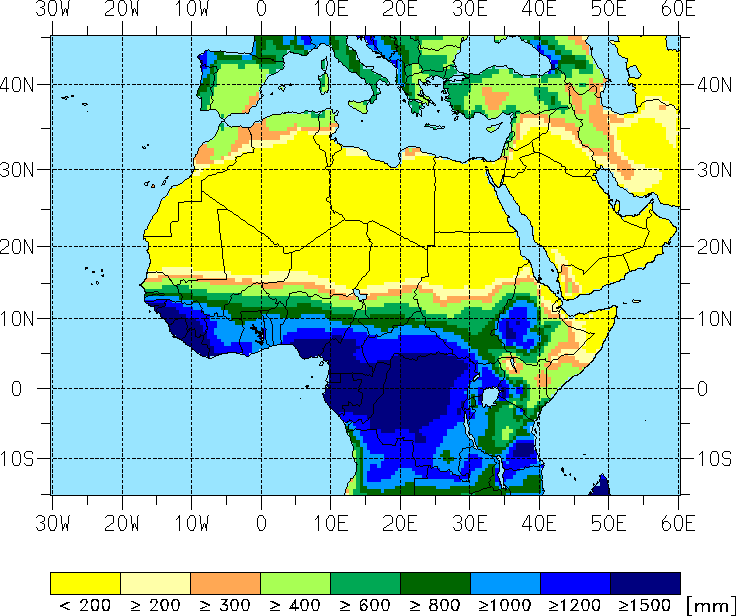
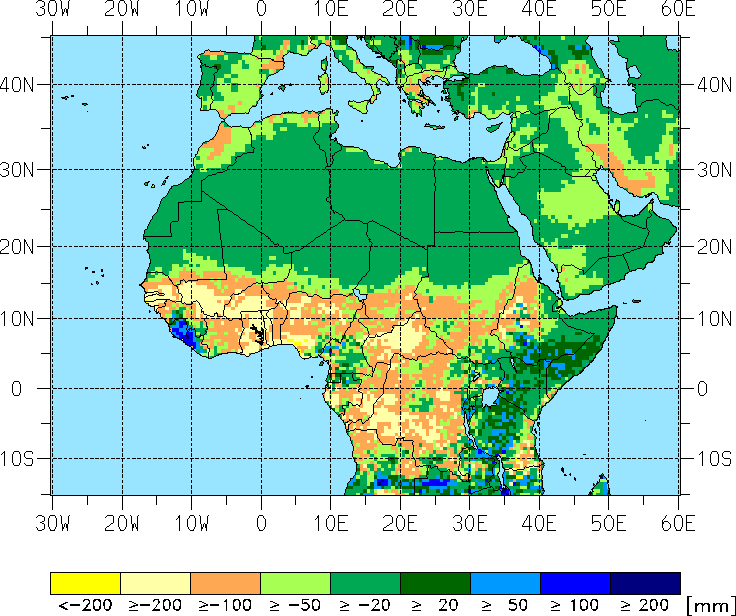
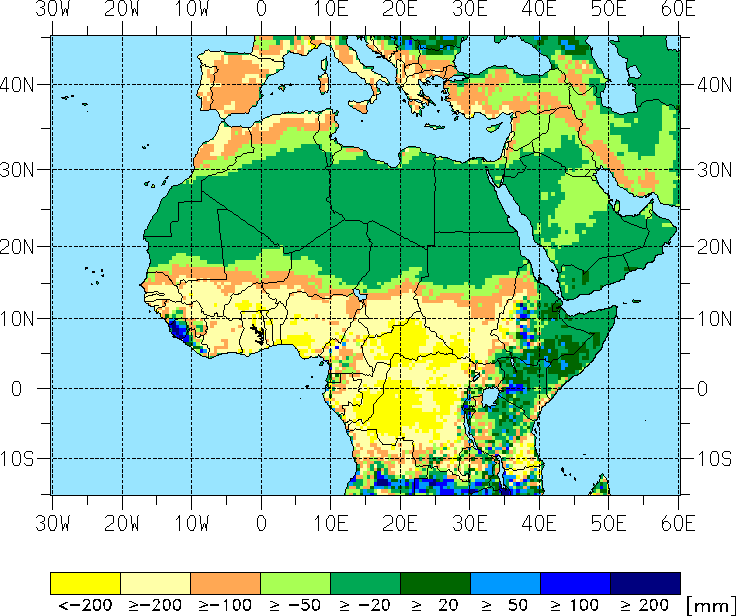
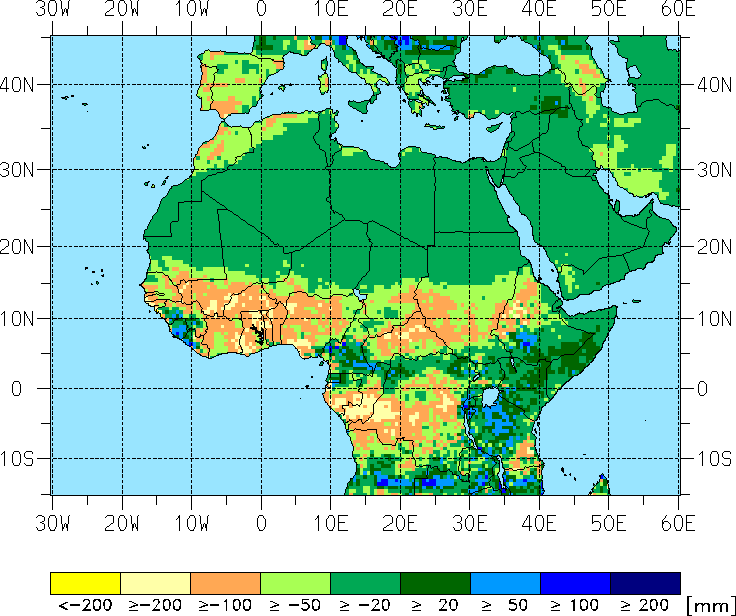
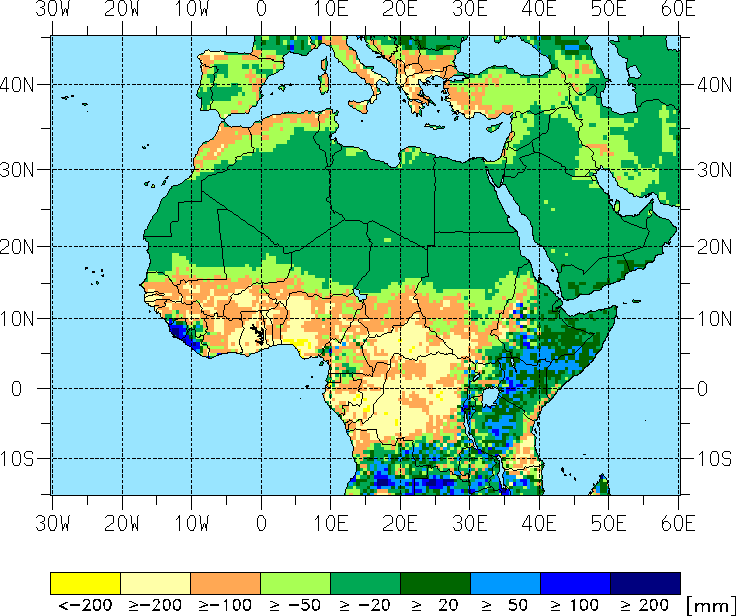
REMO is simulating a prominent precipitation decrease in most parts of West and Central Africa.
By contrast precipitation is projected to increase around the windward side of the Guinean Mountains
and in most parts of East Africa. It turns out that land use and land cover changes are primarily responsible
for the simulated climate response (Paeth et al. 2007).
Correction of REMO precipitation
The simulated precipitation of the REMO runs shows discrepancies relative to observed precipitation
from the Institut de Recherche pour le Développement (IRD). In order to minimise the REMO
model bias with regard to precipitation the rainfall data was corrected relative to
Climatic Research Unit (CRU) precipitation.
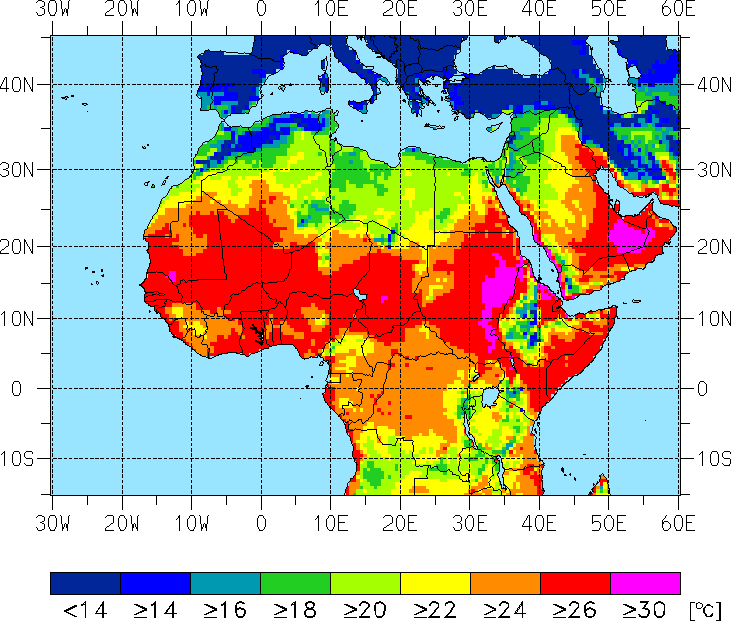
Ta [°C]: 1960-2000
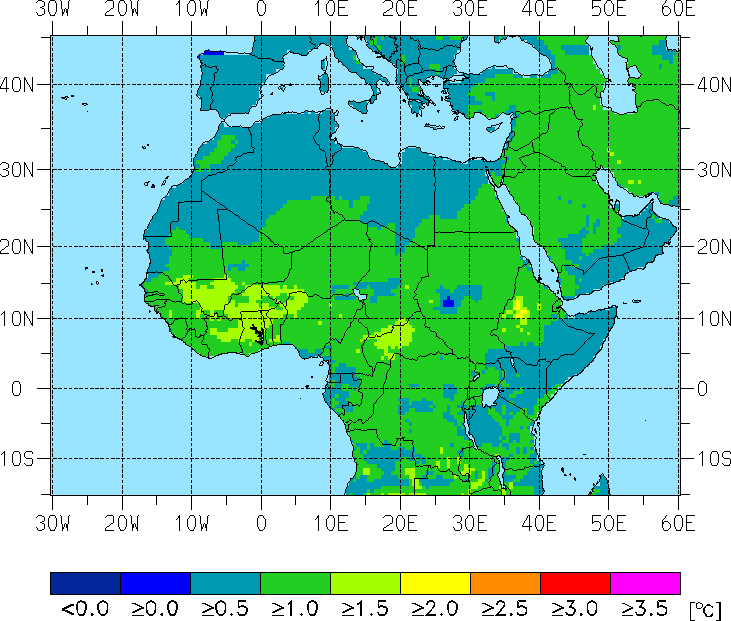
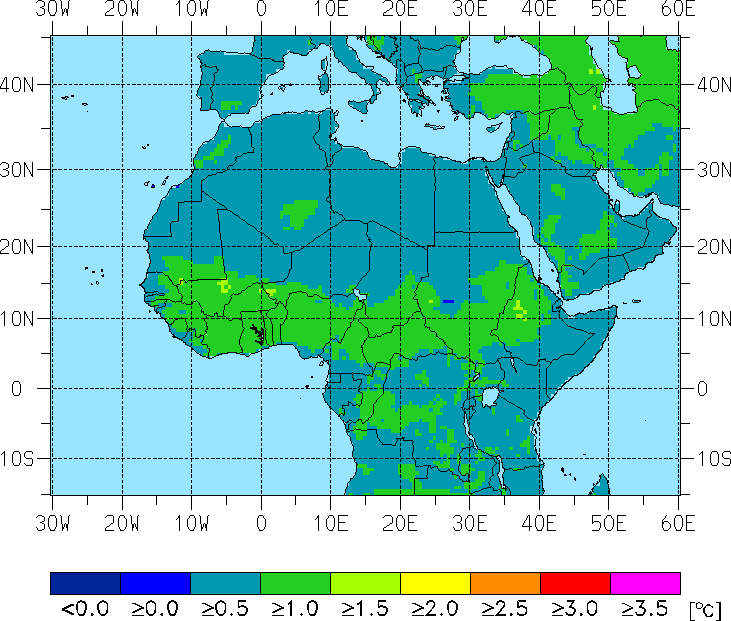
ΔTa [°C]: 2021-2030
ΔTa [°C]: 2041-2050
a)
b)
c)
A1B
d)
e)
B1
Fig. 1:
(a) Averaged mean annual temperature (Ta in °C)
for 1960 to 2000. Differences in the averaged mean annual temperature
(ΔTa in °C) between (b) 2021 to 2030 of the A1B scenario
and the period 1960 to 2000. (c) Same as (b) but for the last decade of the A1B
scenario (2041-2050). (d) And (e) same as (b) and (c) but for the B1 scenario.
RRa [mm]: 1960-2000
ΔRRa [mm]: 2021-2030
ΔRRa [mm]: 2041-2050
a)
b)
c)
A1B
d)
e)
B1
Fig. 2:
(a) Averaged annual precipitation amount (RRa in mm)
for 1960 to 2000. Differences in the averaged annual precipitation amount
(ΔRRa in mm) between (b) 2021 to 2030 of the A1B scenario
and the period 1960 to 2000. (c) Same as (b) but for the last decade of the A1B
scenario (2041-2050). (d) And (e) same as (b) and (c) but for the B1 scenario.