Projections of malaria seasonality for 2001 to 2050
MSM projections
The impact of climate change on the malaria seasonality was assessed by the MSM on a 0.5° grid.
MSM simulations have been performed for the five decades between 2001 and 2050.
The climate conditions of each particular decade is based on the three different
REMO ensemble runs, meaning that the "climate" of each decade is computed by the
data of 30 years.
The seasonality projections were carried out according to the
IPCC (Intergovernmental Panel on Climate Change) climate scenarios A1B and B1
(see page "Scenarios"). Each climate scenario is
including stochastic changes of the land use and land cover that are according to the Food and
Agricultural Organization (FAO). The scenario A1B is including stronger land use and land cover changes
than B1 (Paeth et al. 2007).
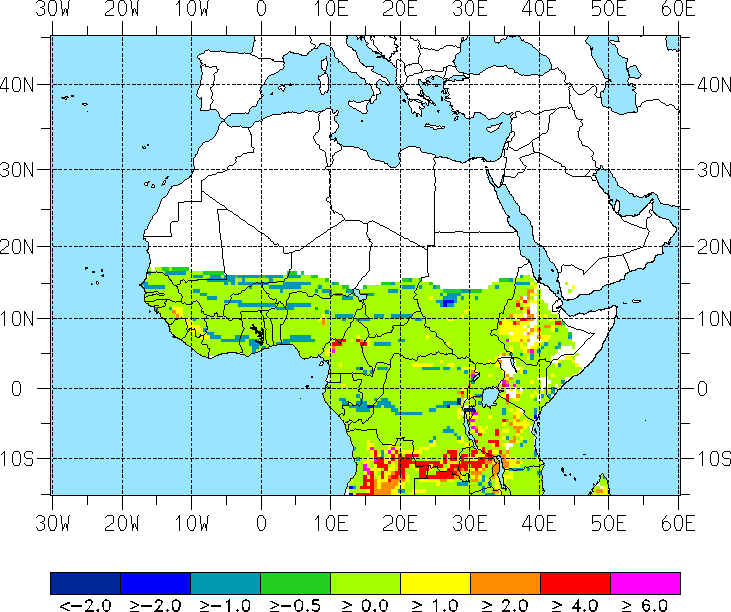
Changes in malaria seasonality
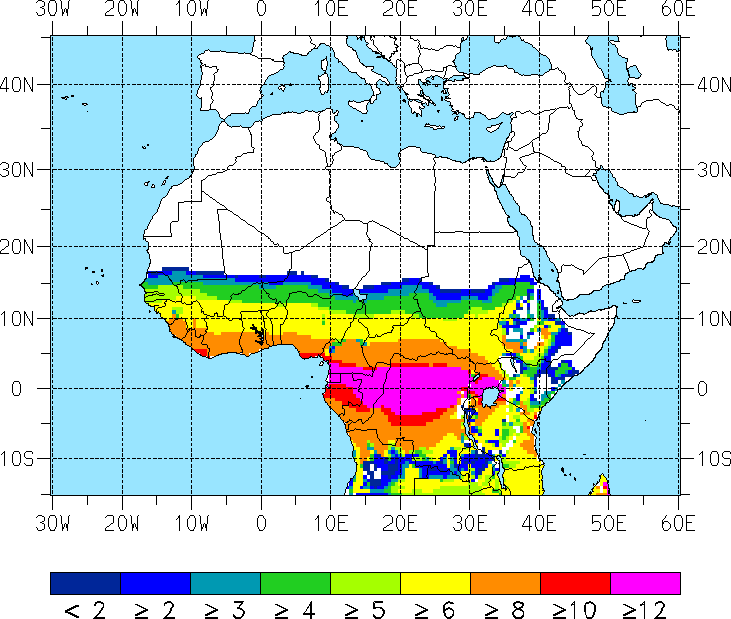
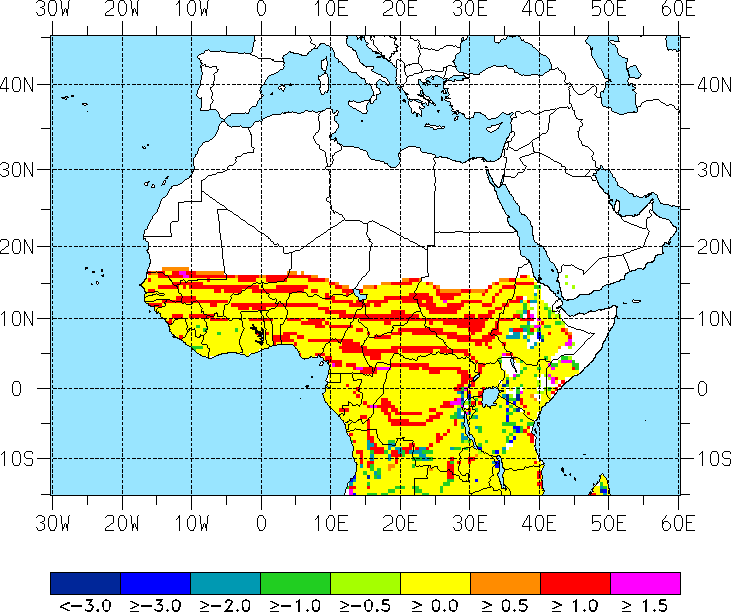
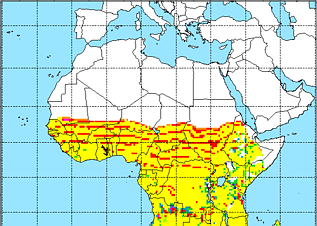
Largely due to the land surface degradation, REMO simulates a prominent surface heating
and a significant reduction in annual rainfall amount over most of tropical Africa in both
scenarios (see page "Data input"). As a consequence, the projections
of malaria seasonality show a decreased length of malaria season in most parts of tropical Africa,
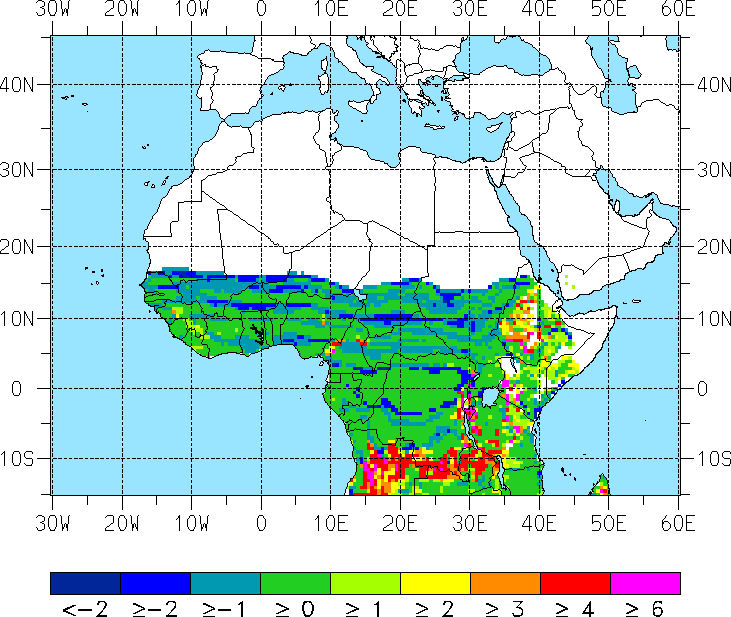
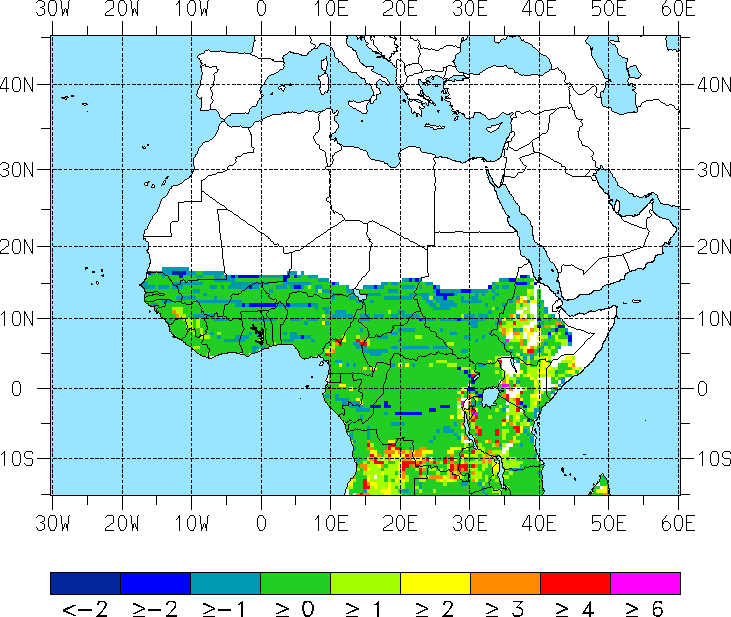
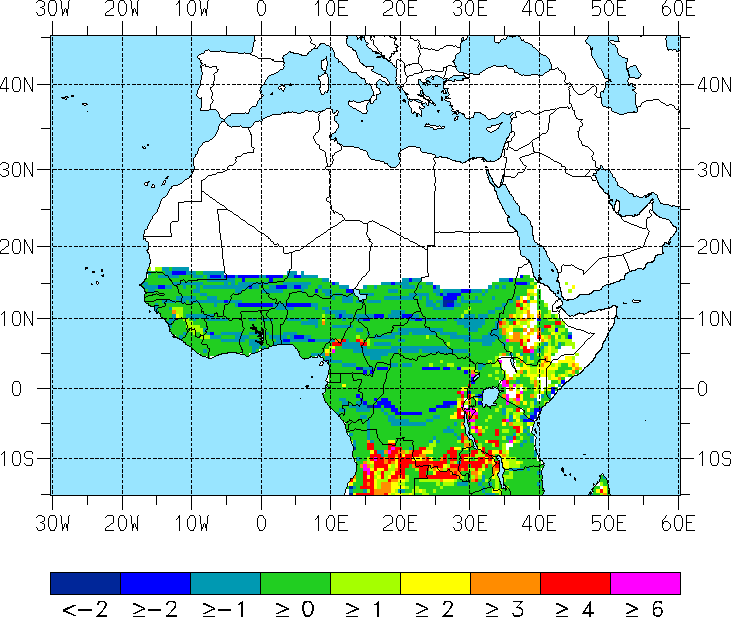
i.e. most pronounced during the decade 2041 to 2050 (Fig. 1c). For example for large parts
of West Africa malaria transmission shortens between one and three months. For this reason
more frequent epidemics or even a malaria retreat are expected to occur in the Sahel. However,
increasing temperatures in highland areas of Cameroon, Nigeria, Guinea and Liberia
are partly leading to longer malaria seasons.
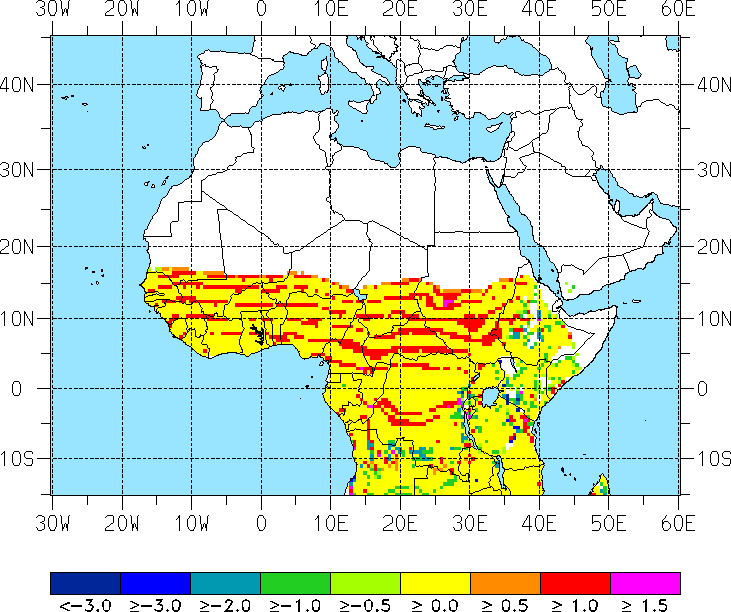
Higher temperatures and nearly unchanged precipitation amounts also cause an increase of
the malaria season in East Africa as well as in parts of Angola and Zimbabwe,
in particular in highland areas (cp. Lindsay and Martens 1998).
Dynamical MSM results according to different periods and scenarios
|
| Seas: 1960-2000 |
| ΔSeas: 2021-2030 |
| ΔSeas: 2041-2050 |
| a) |
|
b) |
|
c) |
|
A1B |
|
| d) |
|
e) |
|
B1 |
 |
|
|
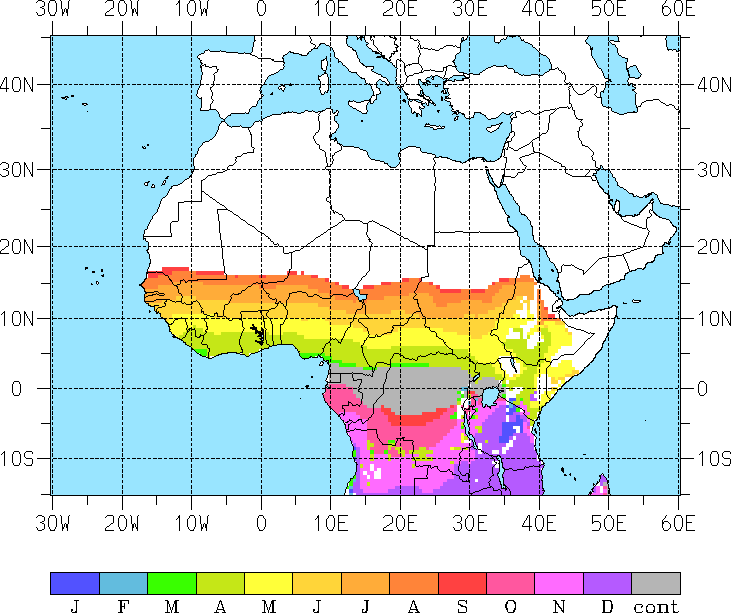
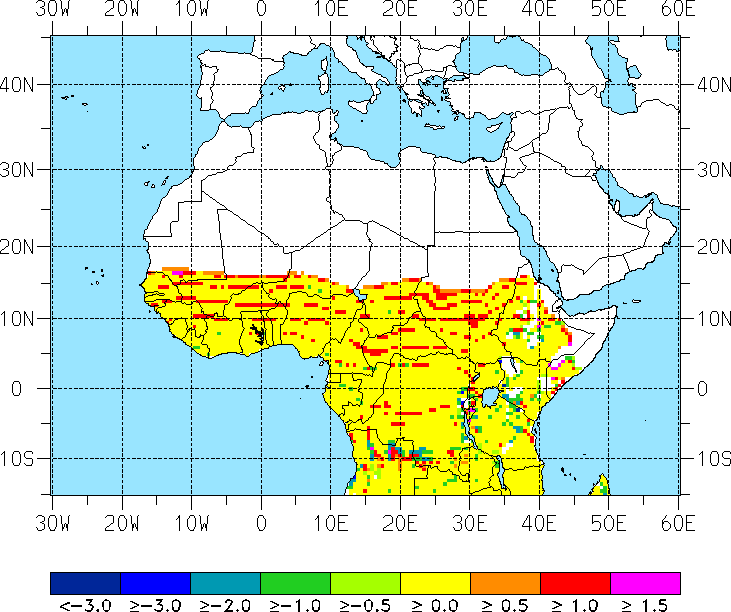
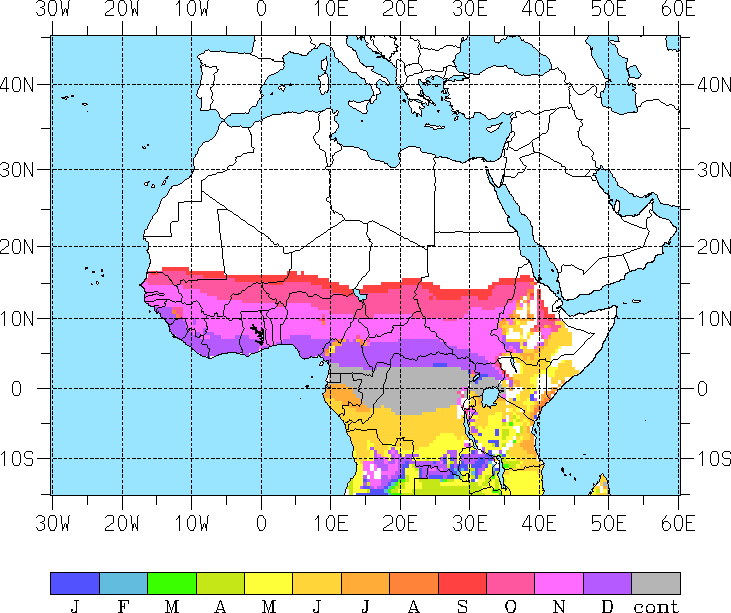
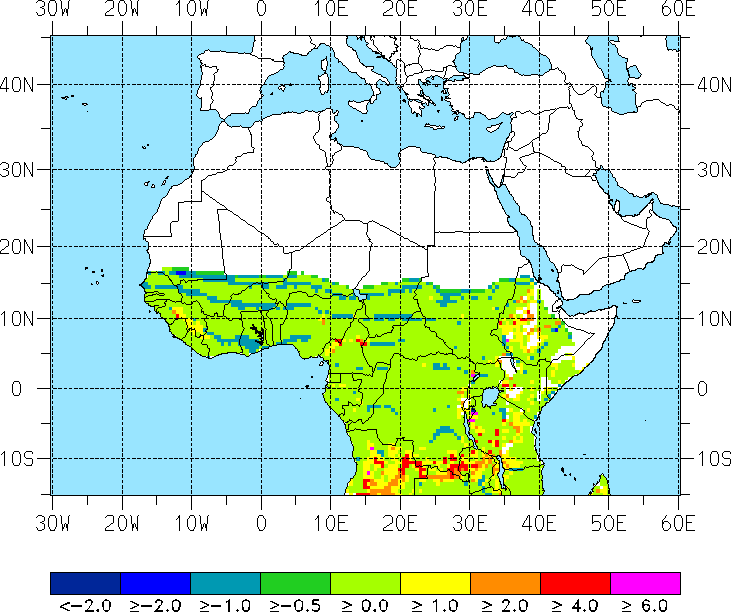
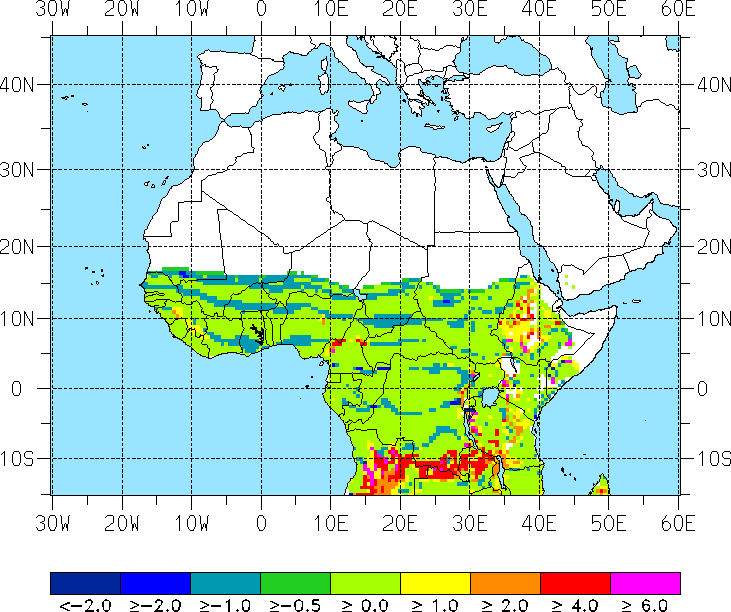
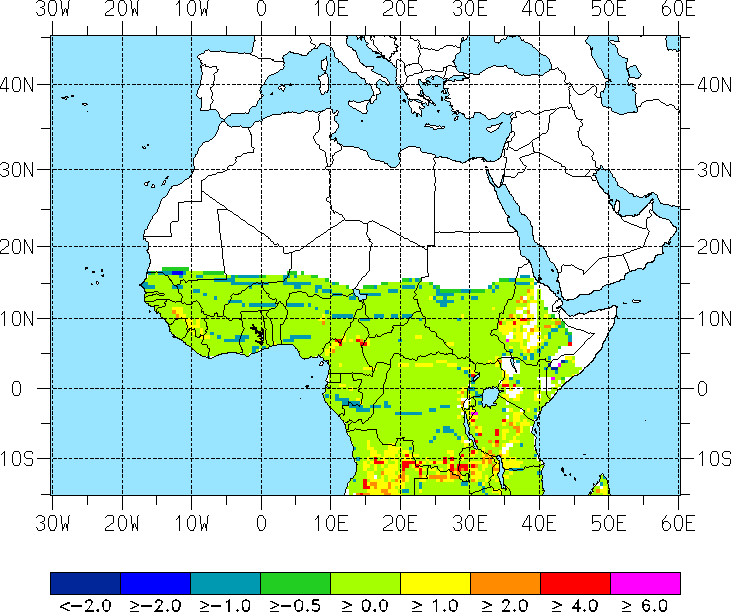
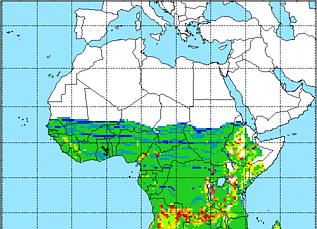
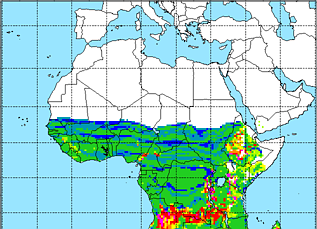
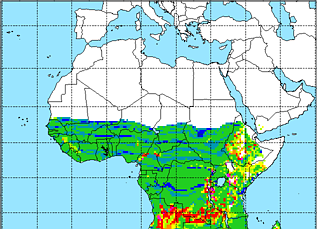
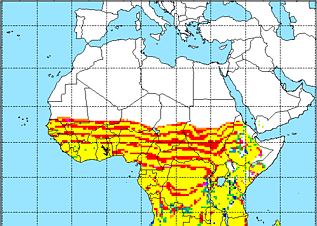
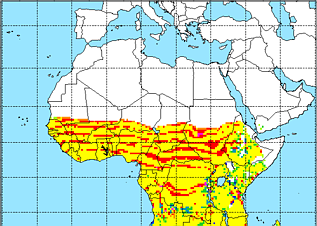
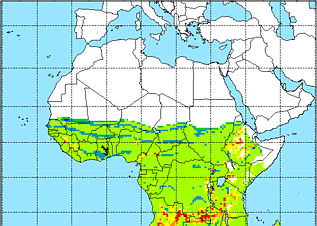
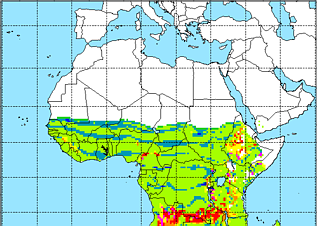
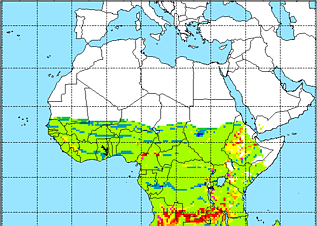
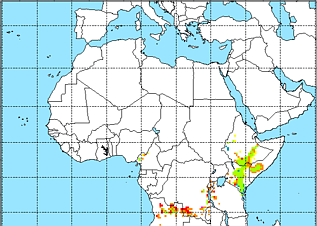
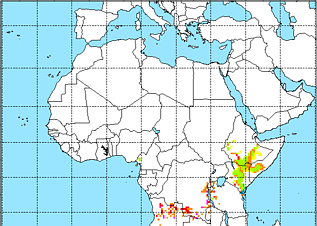
Fig. 1:
MSM simulations of (a) the length of the malaria season (Seas in months) for 1960 to 2000.
Differences in the length of the malaria season (ΔSeas in months)
between (b) 2021 to 2030 of the A1B scenario and the period 1960 to 2000.
(c) Same as (b) but for the last decade of the A1B
scenario (2041-2050). (d) And (e) same as (b) and (c) but for the B1 scenario.
|
| SSeas: 1960-2000 |
| ΔSSeas: 2021-2030 |
| ΔSSeas: 2041-2050 |
| a) |
|
b) |
|
c) |
| A1B |
|
| d) |
|
e) |
|
B1 |
 |
|
|
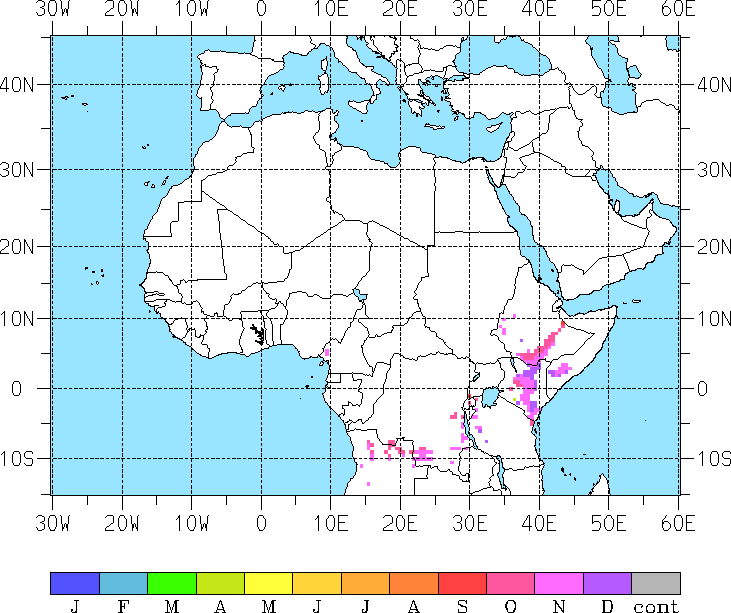
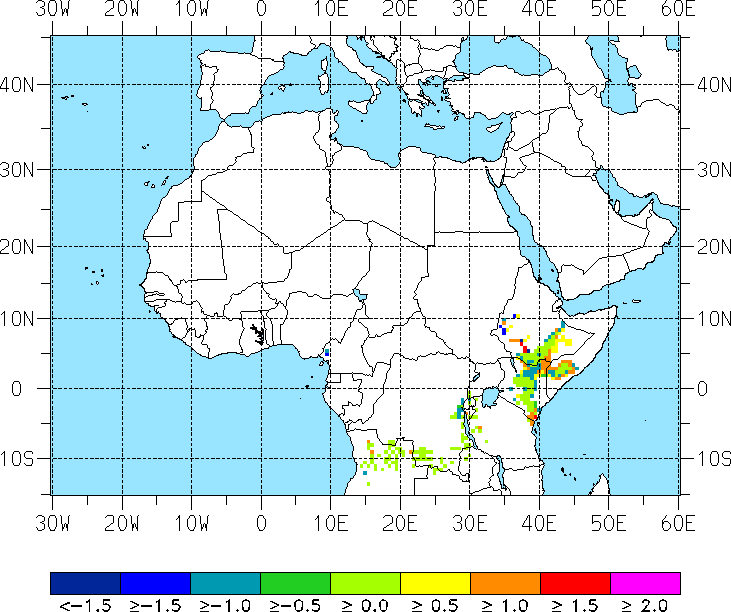
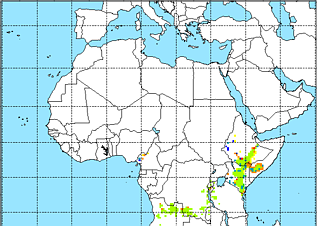
Fig. 2:
MSM simulation of the onset of the malaria season. (a) Start month of the malaria
transmission (SSeas) for 1960 to 2000. Differences in start month (ΔSSeas in months)
between (b) 2021 to 2030 for the A1B scenario and the period 1960 to 2000.
(c) Same as (b) but for the last decade of the A1B scenario (2041-2050).
(d) And (e) same as (b) and (c) but for the B1 scenario. Note, for
areas with two malaria seasons only results for the first season are presented. Note that
negative (positive) values indicate an earlier (later) start of the malaria season.
|
| ESeas: 1960-2000 |
| ΔESeas: 2021-2030 |
| ΔESeas: 2041-2050 |
| a) |
|
b) |
|
c) |
| A1B |
|
| d) |
|
e) |
|
B1 |
 |
|
|
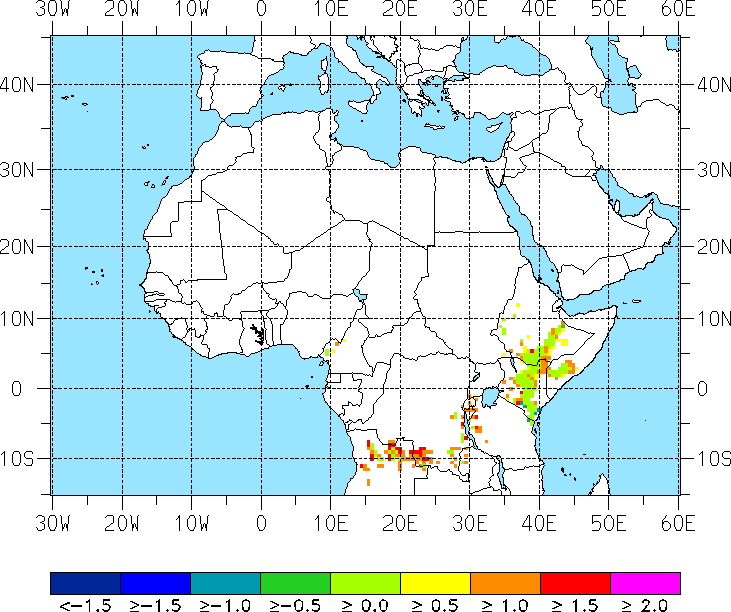
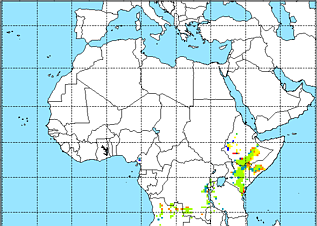
Fig. 3:
MSM simulation of the end of the malaria season. (a) End month of the malaria
transmission (ESeas) for 1960 to 2000. Differences in end month (ΔESeas in months)
between (b) 2021 to 2030 for the A1B scenario and the period 1960 to 2000.
(c) Same as (b) but for the last decade of the A1B scenario (2041-2050).
(d) And (e) same as (b) and (c) but for the B1 scenario. Note, for
areas with two malaria seasons only results for the first season are presented.
Note that negative (positive) values indicate an earlier (later) end of the malaria season.
|
| SSeas2: 1960-2000 |
| ΔSSeas2: 2021-2030 |
| ΔSSeas2: 2041-2050 |
| a) |
|
b) |
|
c) |
| A1B |
|
| d) |
|
e) |
|
B1 |
 |
|
|
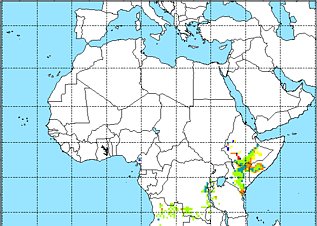
Fig. 4:
Same as Fig. 2 but only for areas with two malaria seasons
(SSeas2 and ΔSSeas2 in months).
|
| ESeas2: 1960-2000 |
| ΔESeas2: 2021-2030 |
| ΔESeas2: 2041-2050 |
| a) |
|
b) |
|
c) |

| A1B |
|
| d) |
|
e) |
|
B1 |
| |
|
|
Fig. 5:
Same as Fig. 3 but only for areas with two malaria season
(ESeas2 and ΔESeas2 in months).
|