Malaria projections for 2001 to 2050
LMM projections
Ensemble runs for the malaria scenarios were performed by the LMM on a 0.5° grid for 2001 to 2050.
The malaria model was forced by high resolution data from the REgional MOdel (REMO). The malaria projections
were carried out according to the IPCC (Intergovernmental Panel on Climate Change) climate scenarios
A1B and B1 (see page "Scenarios"). Each climate scenario is
including stochastic changes of the land use and land cover that are according to the Food and
Agricultural Organization (FAO). The scenario A1B is including stronger land use and land cover changes
than B1 (Paeth et al. 2007).
Malaria prevalence changes
Largely due to the land surface degradation, REMO simulates a prominent surface heating
and a significant reduction in annual rainfall amount over most of tropical Africa in both
scenarios (see page "Data input"). As a consequence, the malaria
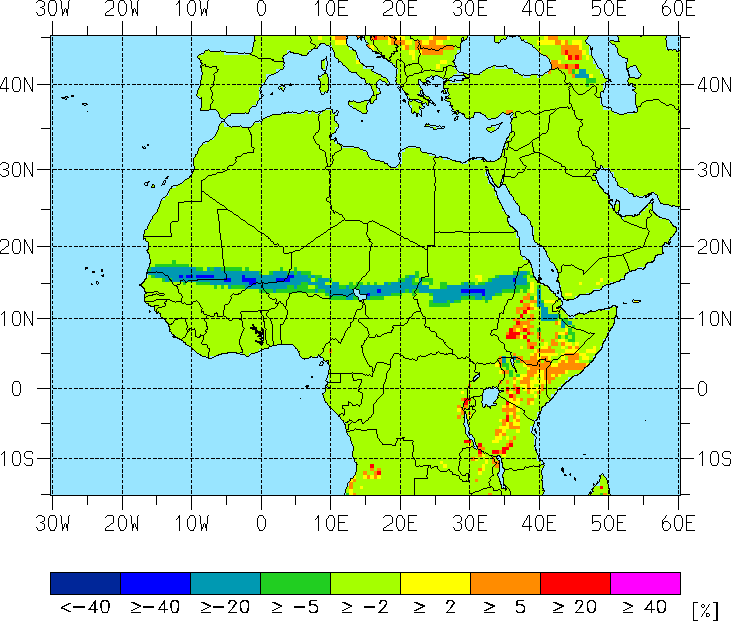
projections show a decreased spread of the malaria disease in most parts of the Sahelian and
Sudanian zone, i.e. most pronounced during the decade 2041 to 2050 (Fig. 1c). By contrast
due to higher temperatures and nearly unchanged precipitation amounts the malaria prevalence
increase in East Africa, in particular in highland areas (cp. Lindsay and Martens 1998).
|
| PRa [%]: 1960-2000 |
| ΔPRa [%]: 2021-2030 |
| ΔPRa [%]: 2041-2050 |
| a) |
|
b) |
|
c) |
|
A1B |
|
| d) |
|
e) |
|
B1 |
 |
|
|
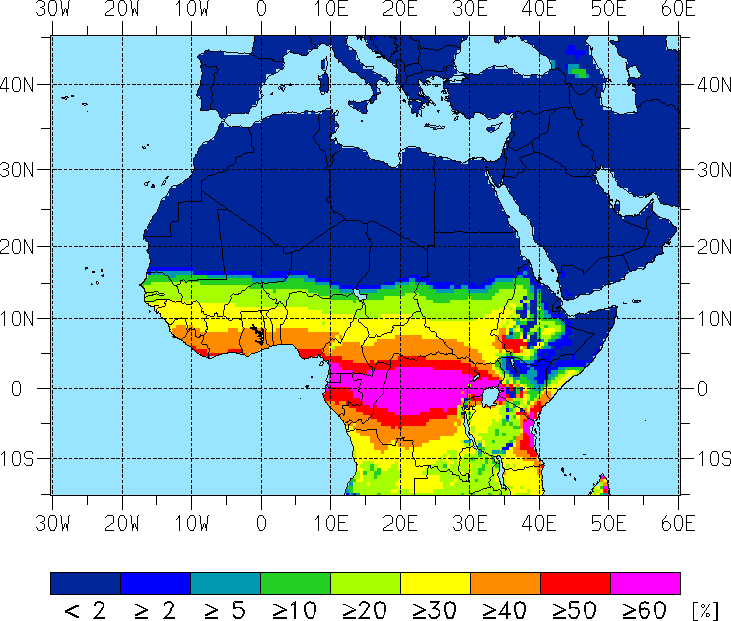
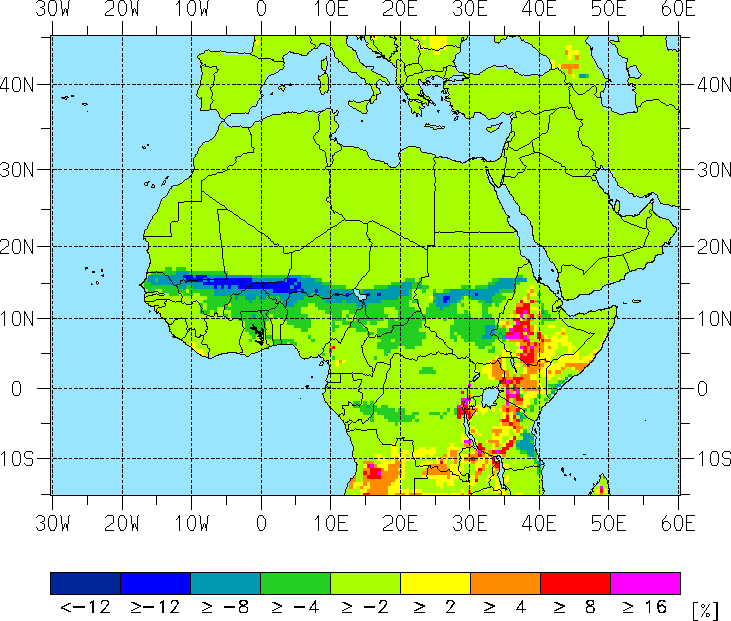
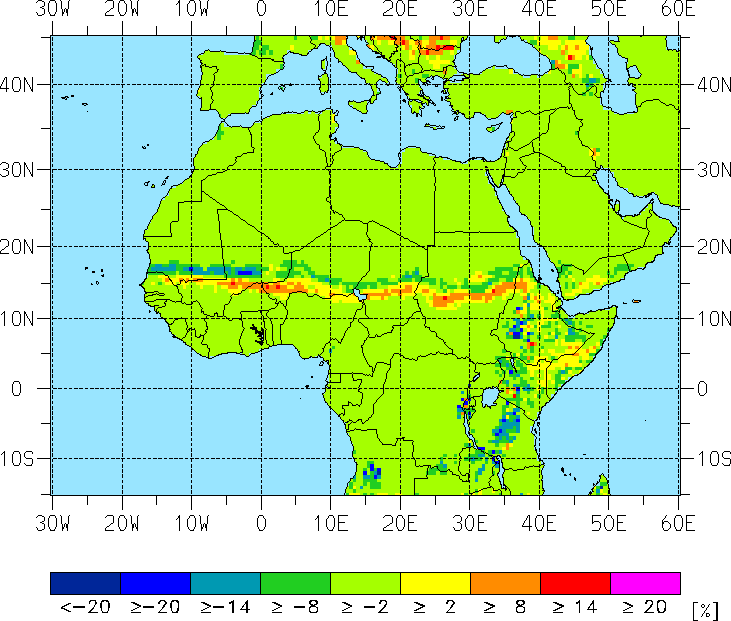
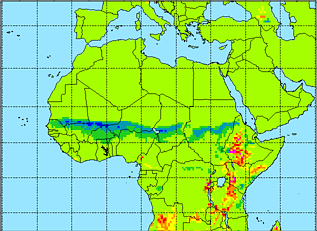
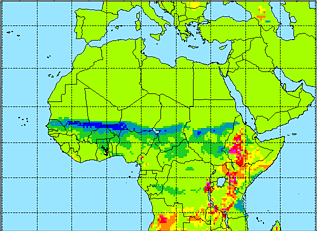
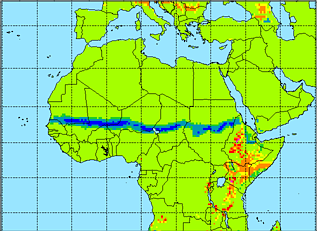
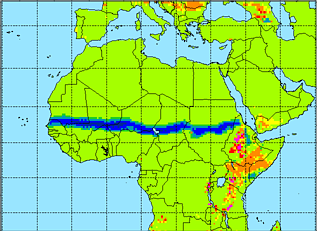
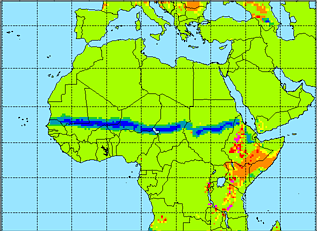
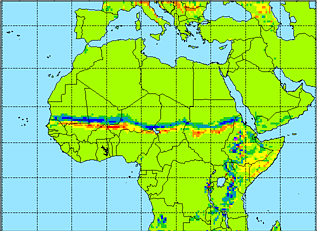
Fig. 1:
(a) Annual averaged prevalence (PRa in %)
for 1960 to 2000. Differences in the annual averaged prevalence
(ΔPRa in °C) between (b) 2021 to 2030 of the A1B scenario
and the period 1960 to 2000. (c) Same as (b) but for the last decade of the A1B
scenario (2041-2050). (d) And (e) same as (b) and (c) but for the B1 scenario.
|
| PRmax,a [%]: 1960-2000 |
| ΔPRmax,a [%]: 2021-2030 |
| ΔPRmax,a [%]: 2041-2050 |
| a) |
|
b) |
|
c) |
| A1B |
|
| d) |
|
e) |
|
B1 |
 |
|
|
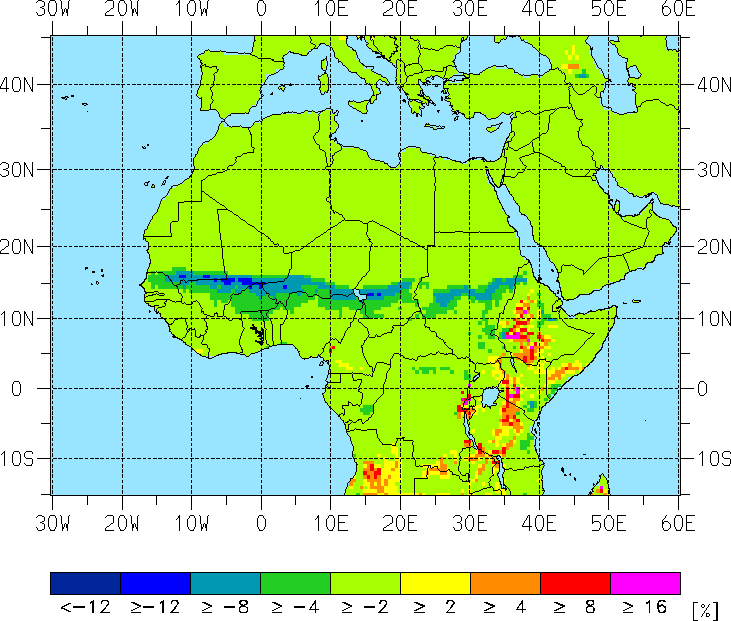
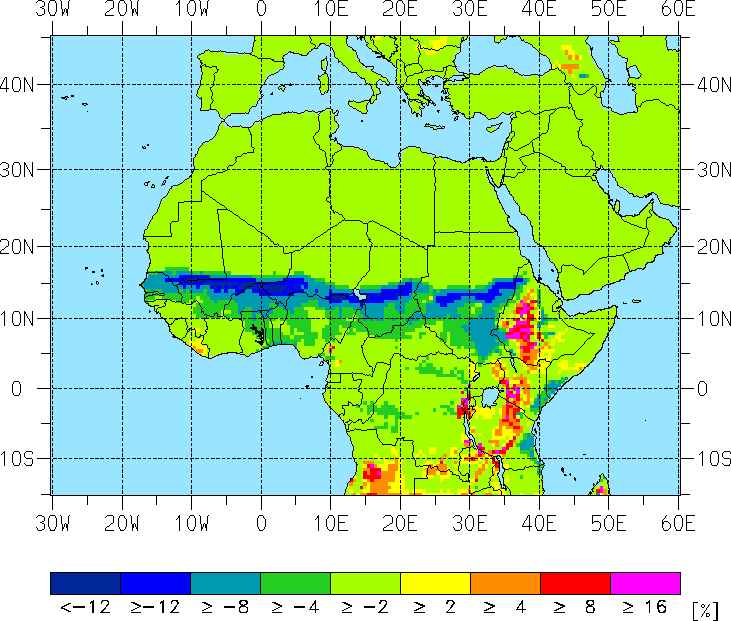
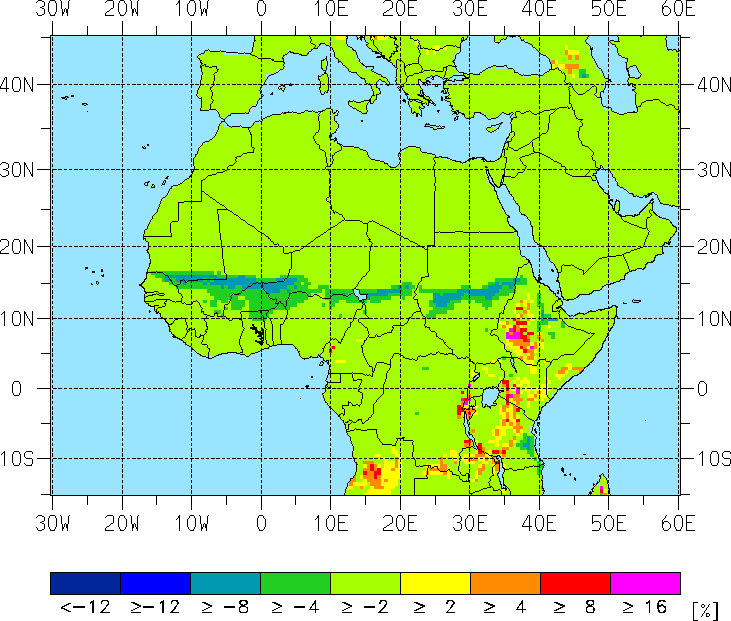
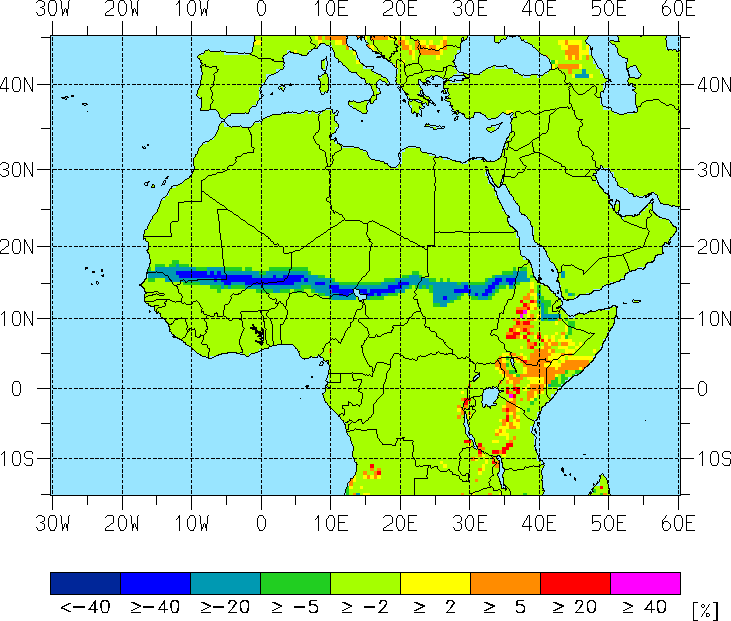
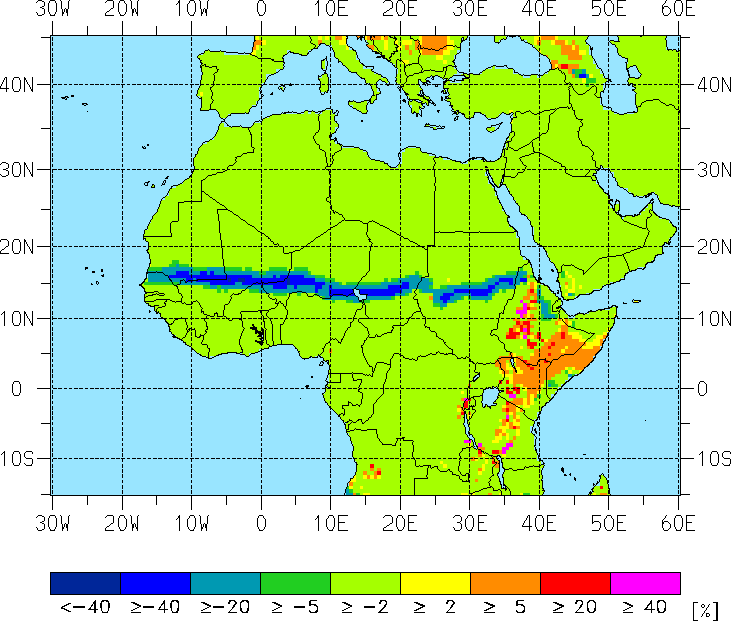
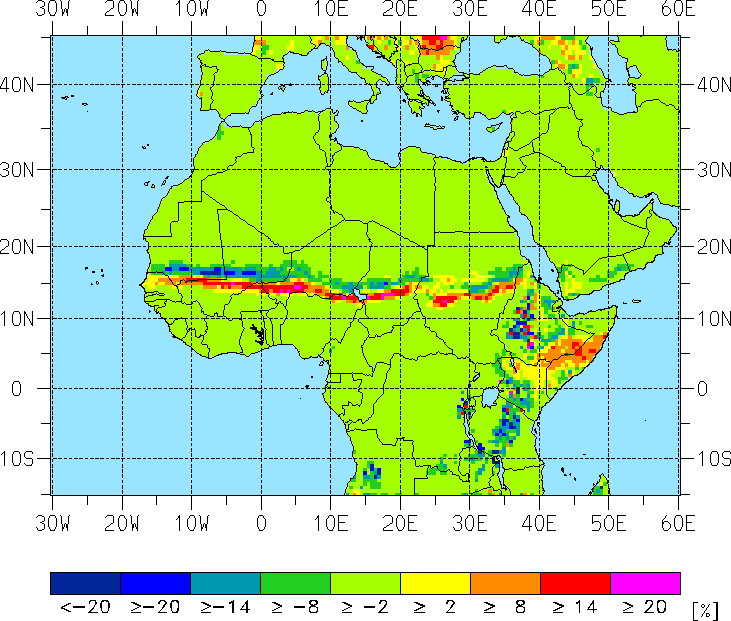
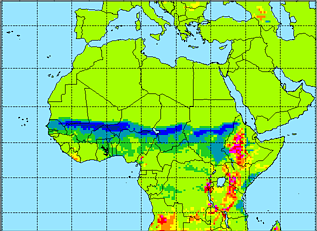
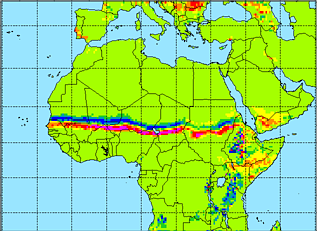
Fig. 2:
(a) Average annual maximum prevalence (PRmax,a in %) for 1960 to 2000. Differences in
the average annual maximum prevalence (ΔPRmax,a) between (b) 2021 to 2030 for the A1B scenario
and the period 1960 to 2000. (c) Same as (b) but for the last decade of the A1B
scenario (2041-2050). (d) And (e) same as (b) and (c) but for the B1 scenario.
|
Risk of epidemics
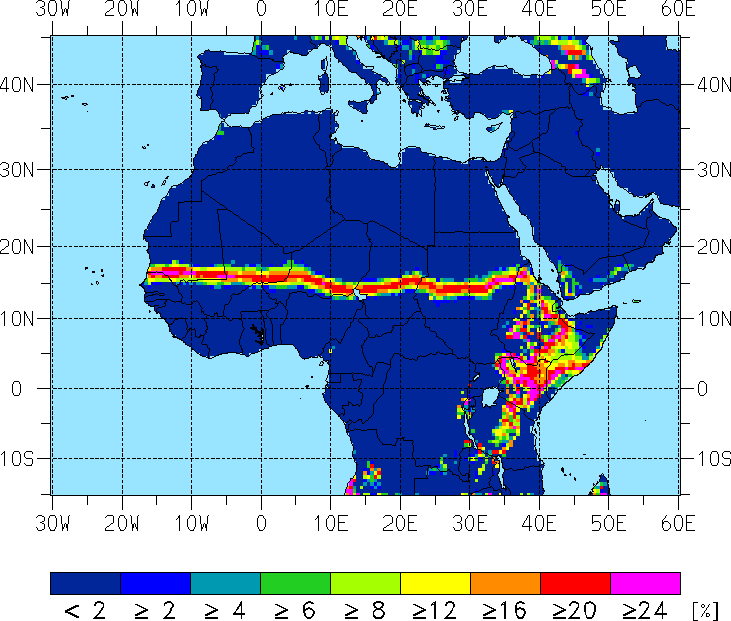
By means of the interannual variability of malaria transmission the risk of epidemics can be analysed
(Fig. 3). According to LMM simulations the standard deviation of the annual maximum prevalence
is large along a strip within the Sahelian zone. The variability of malaria prevalence is reduced in the
northern part of the Sahel. Therefore fewer epidemics or even a malaria retreat is expected in these
regions.
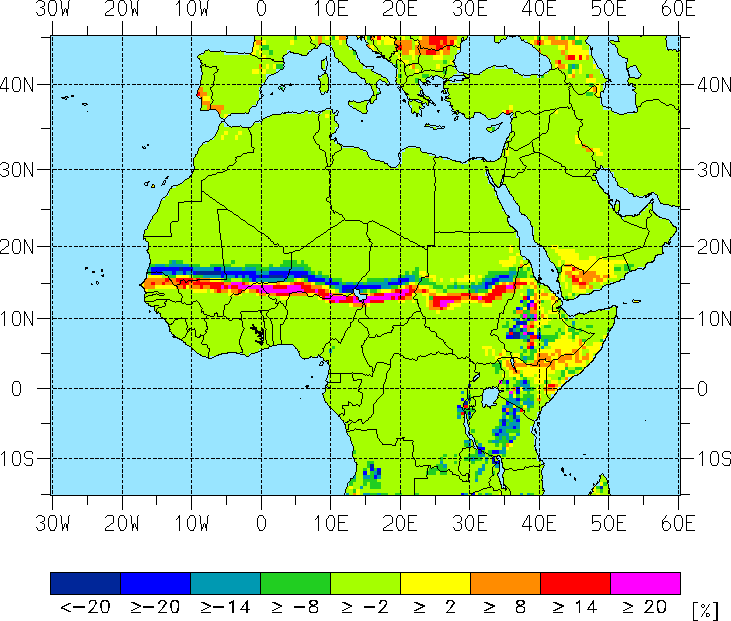
However, variability is increasing in the southern part of the Sahelian zone (between 13 and 16°N).
As a result, epidemics in these more densely populated areas are becoming more likely as parts of the
population will lose their partial immunity against malaria. The maximum of malaria transmission farther
south remains stable. However, the malaria season will lead to a shorter malaria transmission period
(see page "2001-2050: MSM") depending on a dryer rainy season.
According to the period 1960 to 2000 the standard deviation of the annual maximum prevalence is
also high in the East African Highlands (Fig. 3a). In East Africa the change of the malaria
transmission is not as clear as in West Africa. Here areas where malaria transmission is becoming more
stable or instable are side by side. Highland areas that were formerly unsuitable for malaria are
becoming suitable in a warmer future climate and epidemics are becoming more frequent. In some other
areas transmission is increased and people will improve their partial immunity against malaria.
A1B vs. B1
The results regarding LMM ensemble runs for scenario A1B and B1 are similar to each other.
However, changes are in general stronger in scenario A1B than in B1 and the amplitude of change is
mostly pronounced at the end of the simulation period in the 2040s.
|
| &sigma(PRmax,a) [%]: 1960-2000 |
| Δ{σ(PRmax,a)} [%]: 2021-2030 |
| Δ{σ(PRmax,a)} [%]: 2041-2050 |
| a) |
|
b) |
|
c) |
| A1B |
|
| d) |
|
e) |
|
B1 |
 |
|
|
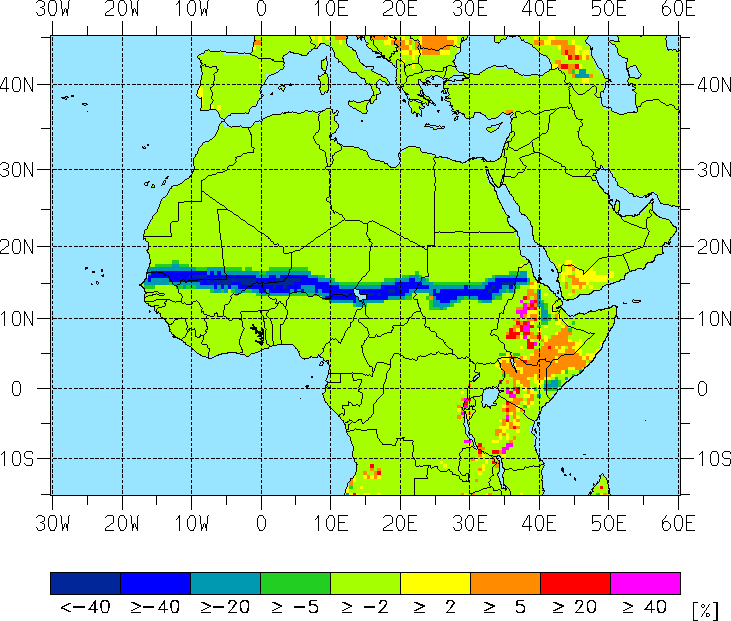
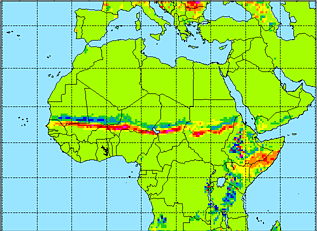
Fig. 3:
(a) Standard deviation regarding the annual maximum prevalence
(σ(PRmax,a) in %)
for 1960 to 2000. Differences in the standard deviation of the annual maximum prevalence
(Δ{σ(PRmax,a)})
between (b) 2021 to 2030 for the A1B scenario and the period 1960 to 2000. (c) Same as (b)
but for the last decade of the A1B scenario (2041-2050). (d) And (e) same as (b) and (c)
but for the B1 scenario.
|