| |
|
LMM present-day runs
The present-day ensemble runs were performed by the LMM on a 0.5° grid for 1960 to 2000. The LMM was
driven by high resolution data from the state-of-the-art regional climate model REMO (REgional MOdel),
with a land use and cover according to the Food and Agriculture Organization (FAO)
(see page "Scenarios").
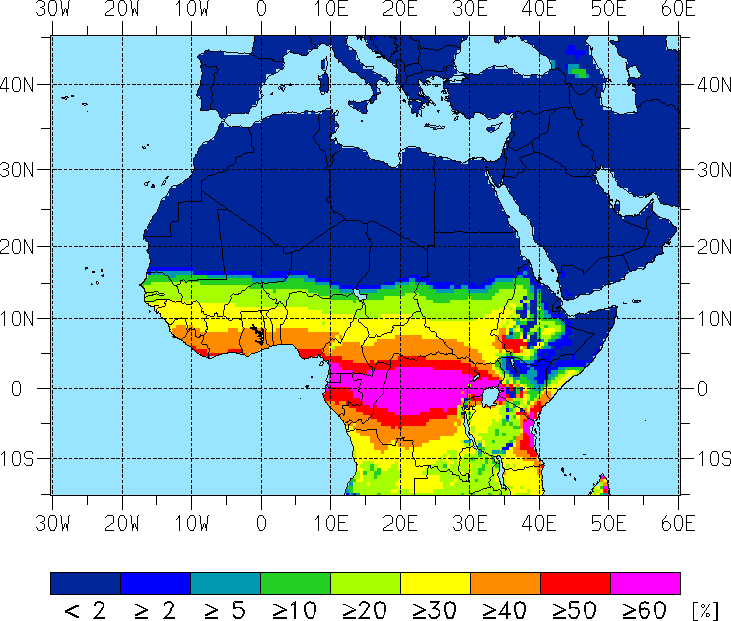
Malaria prevalence
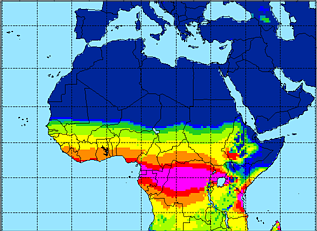
In agreement with the annual precipitation amounts, the two-dimensional LMM simulations
show a decrease in the average annual mean malaria prevalence from the Guinea Coast
towards the Sahel for the period 1960 to 2000 (Fig. 1a).
The highest averaged annual mean prevalence are found in the equatorial tropics in the area of the largest
precipitation amounts, e.g. in southern Cameroon, Gabon, Congo, and Uganda. Rural localities in these
areas are often characterised by a perennial malaria transmission (e.g. Carnevale et al. 1992; Bonnet et al. 2002).
The presence of highlands in East Africa is causing a more complex pattern of the malaria distribution.
Parts of Ethiopia, Kenya, Tanzania, Rwanda and Burundi are covered by highlands and are therefore
characterised by lower temperatures than nearby plain areas. Note that temperatures in the order or even lower than the
sporogonic temperature threshold prohibit the transmission of the malaria disease. Those are the reason
for low or even zero malaria prevalences in the East African highlands. By contrast the lack of
malaria transmission around the Horn of Africa is due to low annual precipitation amounts.
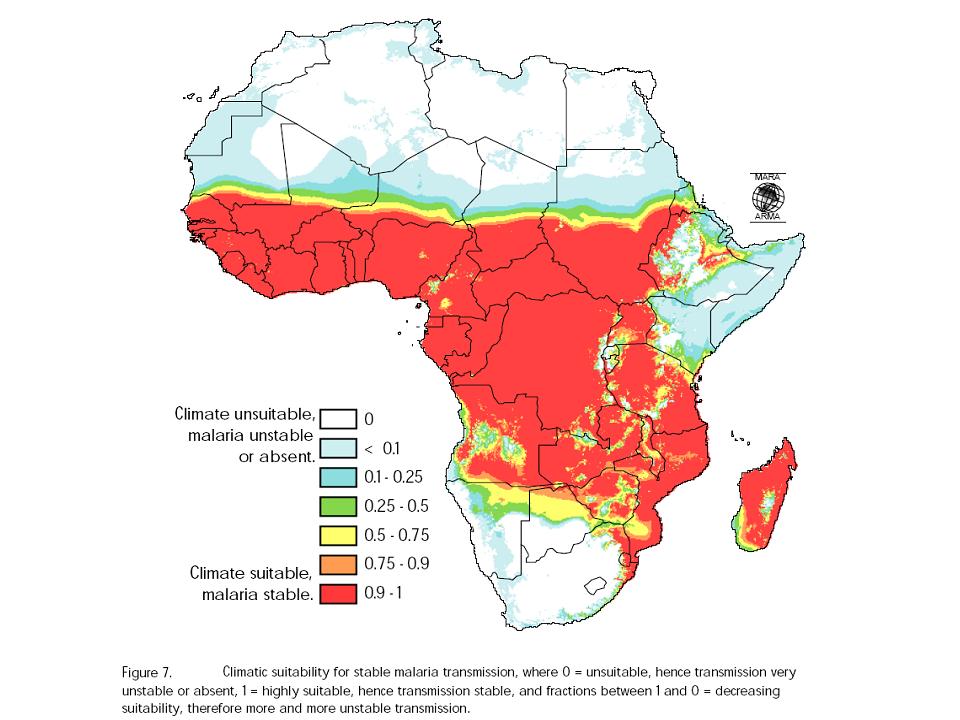
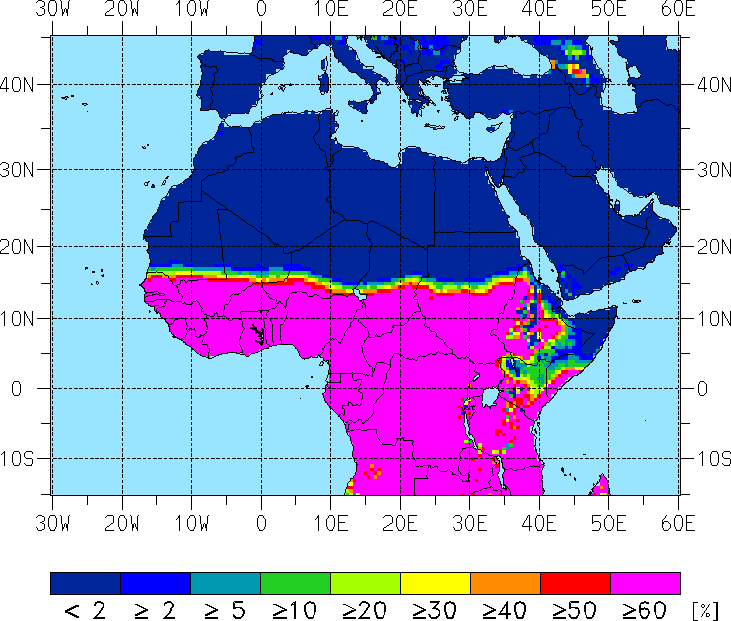
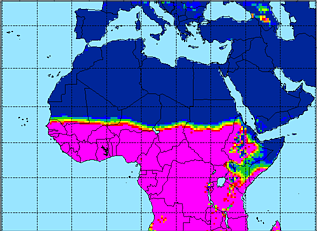
LMM vs. MDM
The area of the malaria distribution is fairly consistent with that indicated by the MARA Distribution Model
(MDM; Craig et al. 1999; cp. Fig. 2). The upper limit of the malaria prevalence
(due to the LMM design, the prevalence is not able to get higher than about 65%; see the discussion
on page "LMM") is nearly reached every year in the area
of a MARA climate suitability of 0.5 and higher values (cp. Fig. .1a and Fig. 2). The effect of the
East African Highlands is also visible in the pattern of the average annual maximum prevalence.
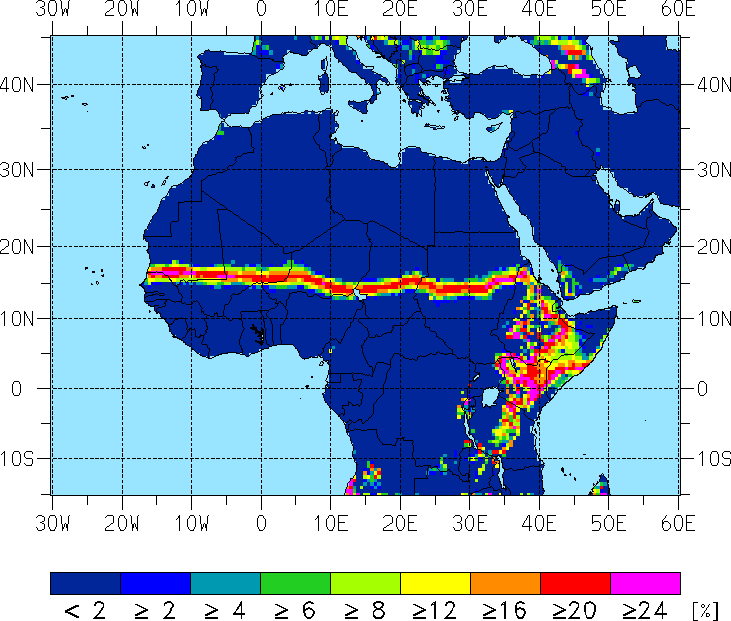
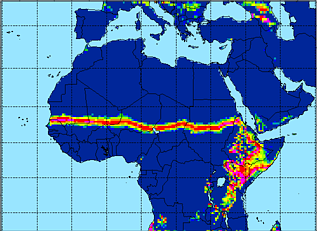
Risk of epidemics
By means of the interannual variability of malaria transmission the risk of epidemics can be
analysed. Epidemic areas are characterised by a malaria prevalence increase for a short period of
time and are therefore likely to show high values of the standard deviation of the annual maximum model
prevalence. According to the LMM simulations the standard deviation of the annual maximum prevalence
is large along a strip within the Sahelian zone between 13 and 18°N (Fig. 1c).
The northern part of that region shows a low average annual maximum prevalence. Therefore malaria is likely
to be absent in several years and malaria epidemics are probable in that region. As compared to the results based
on MARA these epidemic-prone areas seem to be displaced to the South. The epidemic-prone area
as defined by Snow et al. (1999) is adjacent to the North of the strip. However, there are
uncertainties in the definition of epidemic areas. Cox et al. (2007) show that there is still
a huge amount of uncertainty surrounding current methods and estimates of malaria epidemic burden.
The area between the Guinean coast region and the Sudanian zone of West Africa is classified as endemic since
the malaria spread in the simulated population is more stable from year to year.
The standard deviation of the annual maximum prevalence is also large in parts of East Africa. The
highlands of East Africa are well known epidemic-prone areas (e.g. Minakawa et al. 2002).
In areas where daily mean temperatures are in the order of the
sporogonic temperature threshold the spread of the malaria disease is governed by temperatures rather
than precipitation amounts.
In highlands unusually warm temperatures can lead to disastrous malaria epidemics. The most notable
epidemic in Ethiopia in 1958 was leading to about 150,000 deaths among a largely nonimmune population
(Cox et al. 2007).
|
| PRa [%] |
| PRmax,a [%] |
| σ(PRmax,a) [%] |
| a) |
|
b) |
|
c) |
|
|

|
|

|
|

|
|
Fig. 1: (a) Average annual mean malaria prevalence (PRa in %), (b) average annual maximum prevalence
(PRmax,a in %) and (c) standard deviation regarding the annual maximum prevalence
(σ(PRmax,a) in %) for
1960 to 2000 based on LMM ensemble simulations.
|
|
|
|
|

|
|
Fig. 2: Fuzzy model for sub-Saharan Africa, showing the suitability of temperature and
rainfall conditions (for details cp. Craig et al. 1999) with regard to the climate conditions between
1920 and 1980 (Hutchinson et al. 1996). A value of 1 means that climate conditions are suitable
for malaria; a value of 0 means conditions are unsuitable. Fractions from 0 to 1
indicate an increasingly suitable climate (Fig. 7 in MARA/ARMA 1998).
|